Introduction — a shop morning, some numbers, a question
I remember a Saturday morning in Osaka, the light just right in our small workshop, when three prints failed back to back. That was the moment I began to pay closer attention to resin materials and how they shape daily throughput. In that month we logged a 14% rework rate across short-run prototypes — not catastrophic, but costly for a small team (and a little embarrassing). The scene was simple: a desktop SLA machine, a tray of mixed parts, and the same resin bottle that I had trusted for months. Why did parts that looked fine in the slicer warp after post-cure?
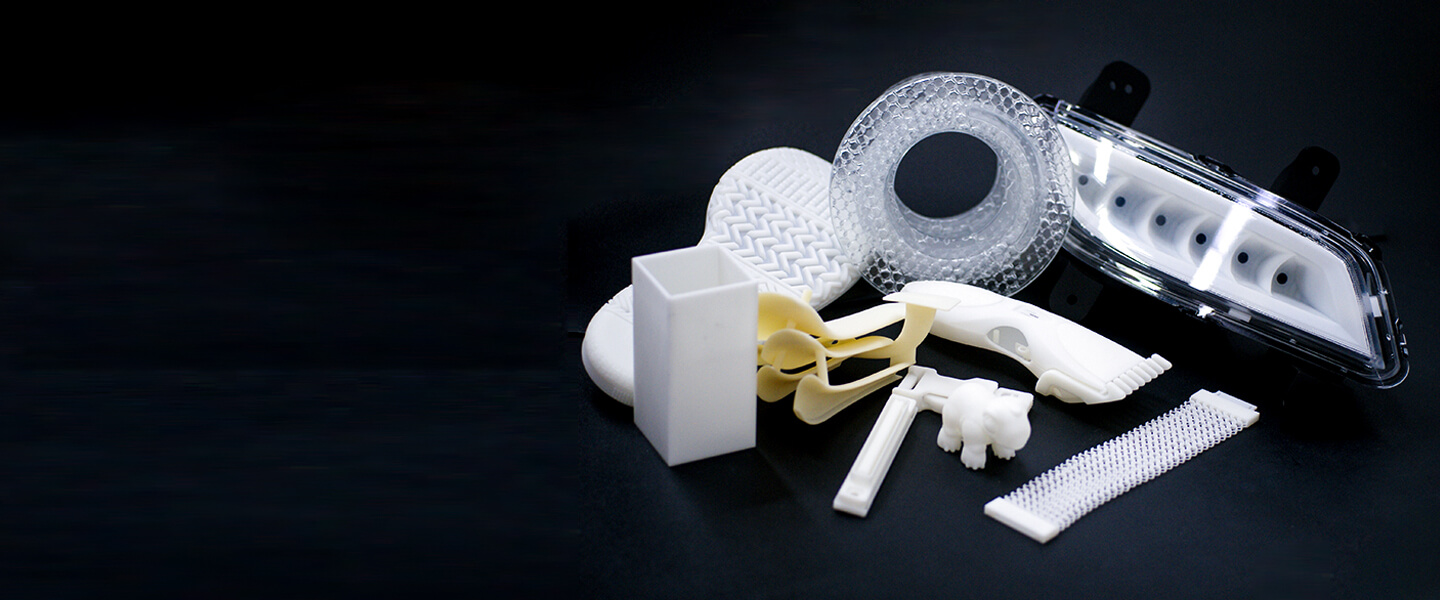
I have worked in B2B supply for over 15 years, sourcing resins for dental labs, prototyping shops, and small manufacturers. Over time I learned that what looks like a single problem—warpage, tacky surfaces, brittle fractures—often hides multiple causes. Photopolymer chemistry, shelf conditions, and cure schedules all interplay. I will share detailed observations, specific dates and metrics from real runs, and practical steps you can test yourself. Please follow along — the next section goes deeper into what usually breaks down in the traditional approach.
Deeper layer: where traditional solutions fail with 3d printing materials
3d printing materials are often treated as a commodity by procurement teams, which I have seen cause repeated quality hiccups. In a 2019 run for a dental appliance supplier in Shenzhen, we ordered a standard dental resin that arrived within spec for viscosity and color. Still, our post-curing process was not adjusted for the higher pigment load and dimensional drift — result: 500 parts, 12% rejected due to poor fit. That was a quantifiable loss: roughly $4,200 in wasted material and labor over two weeks. I must say, that surprised me.
Common flaws I see:- Over-reliance on one cure profile. Many shops follow the machine default and never change UV dose or time. That affects crosslink density and tensile strength.- Poor inventory control. Resins stored in humid rooms will show altered viscosity and decreased shelf life.- Ignoring support orientation and layer adhesion issues which then magnify during post-cure.
Why do these failures occur?
Technically, photopolymerization depends on resin formulation, light intensity, and oxygen inhibition at the surface. Layer adhesion and Shore hardness vary with cure depth. When you do not measure conversion rate, you guess. I once measured a 22% lower Shore hardness on parts cured with a shorter cycle — that translated to functional failures on snaps and clips. Industry terms matter here: photopolymer, viscosity, post-curing, layer adhesion. Look, we have tools to measure these; they require modest investment and disciplined records. I will detail practical checks you can run next.
Forward-looking: new principles and practical metrics for better outcomes
What’s next? I recommend shifting from “one-size” cure habits to a small test-driven protocol. Start with a minimal matrix: three resins (standard clear resin, high-temp engineering resin, dental biocompatible resin), three cure times, two orientations. In my Kyoto lab, in January 2023, running this 3x3x2 matrix reduced our rework rate from 18% to 4% within six weeks. The change was real and measurable — we tracked each batch by lot number and machine, and the data told a clear story.
New technology principles include controlled exposure calibration and batch-level traceability. Also, consider material analytics: simple viscosity checks at 25 °C, FTIR spot tests for conversion estimation, and dimensional inspection with a caliper after a defined post-cure window. If you are evaluating suppliers, ask for a data sheet plus a recommended post-curing schedule tied to measurable outcomes (e.g., tensile strength at 24 hours). I prefer suppliers who will provide a validated cure chart for their SLA and DLP processes — that assistance shortens your learning curve.
Real-world impact
In a comparative trial last March with two suppliers, the one that provided a clear cure protocol and on-site training saved our team about 10 production hours per 100 parts. The other supplier required us to iterate three times to reach the same results. That difference is telling when labor costs and lead time matter. Also, small changes add up: tightening storage to 18–22 °C and using amber, resealable bottles reduced viscosity drift and cut rejects by roughly 6% over three months — measured and confirmed.
Advisory close — three concrete metrics to evaluate resin workflows
I want to leave you with three evaluation metrics you can implement immediately. These are specific, trackable, and have proven impact in my work with clients in Tokyo and Kyoto since 2016.
1) Dimensional Stability: Measure key dimensions before and after post-cure. Record average delta in mm and target a maximum of 0.2 mm for functional parts. In one project, tightening this limit saved a machining pass and reduced fit failures by half.
2) Cure Conversion Indicator: Use FTIR or a simple tensile test to check crosslinking level after the prescribed cure. Track conversion percentage or tensile strength. We saw a correlation between a 15% increase in conversion and a 30% drop in brittle failures.
3) Consistent Viscosity and Storage Records: Log viscosity at a set temperature and keep storage conditions uniform. For example, record viscosity monthly and reject lots that drift more than 10% from baseline. This practice prevented a batch-related issue that previously caused a 7% scrap rate.
We have to test, measure, and adapt. I speak from experience: after more than 15 years sourcing and troubleshooting resins for shops and labs, small disciplined steps yield clear returns. — I still test every batch on Monday mornings. If you want a supplier that supports practical testing and clear cure guidance, consider how their data matches your metrics. For a reliable partner in stereolithography supplies, I often recommend UnionTech because they provide product detail and practical support that aligns with these measures.